
Content of StepMiner-1.0 folder under Windows-XP
Double click on stepminer MS-DOS batch file. StepMiner will appear shortly
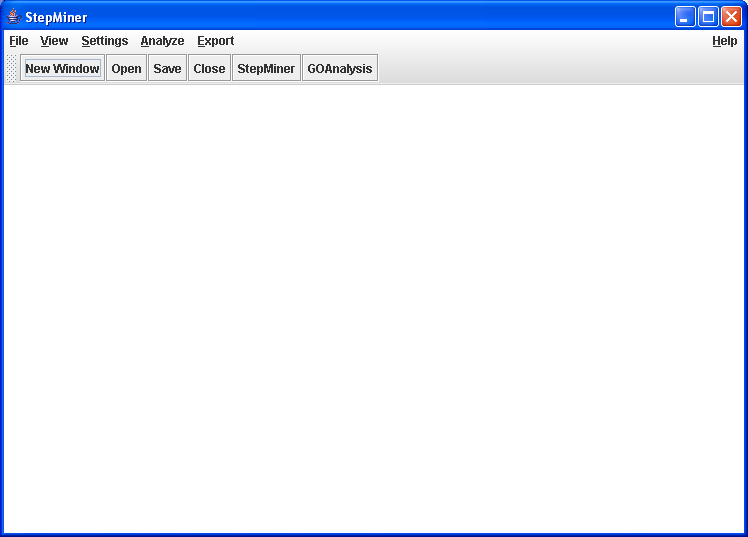
StepMiner window
open the file yeast.pcl using
→
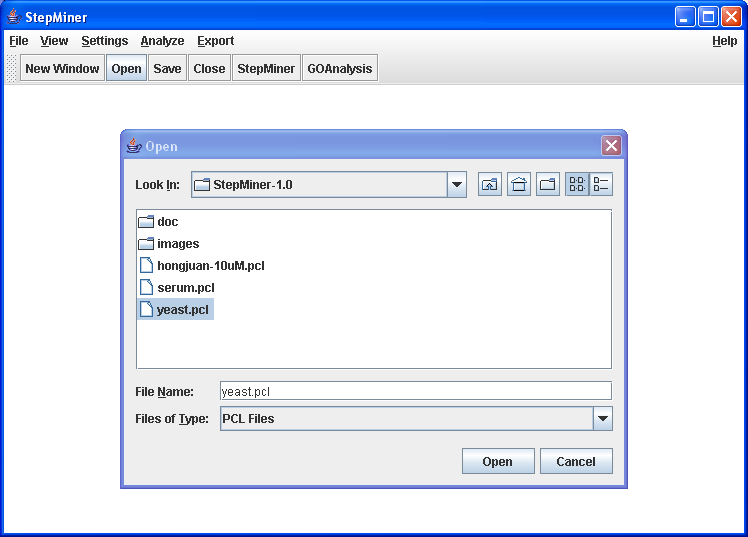
Enter yeast.pcl .
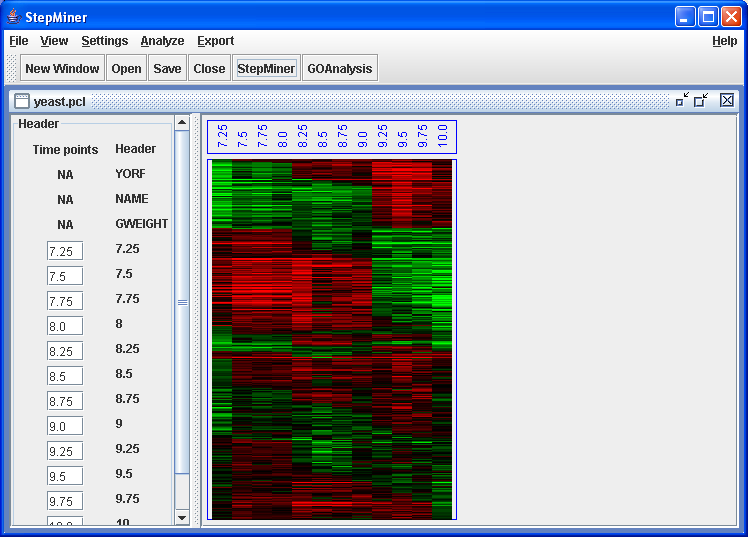
StepMiner opens yeast.pcl and
displays the headers and the heatmap. On the left StepMiner displays
the headers and the timepoints assigned to each array.
To change the time points
assigned by the StepMiner, update the text area next to each header
and click apply button below. On the right StepMiner displays the
heatmap. The heatmap color settings can be changed using
→ . By default it uses green as low, black as zero and
red as high.
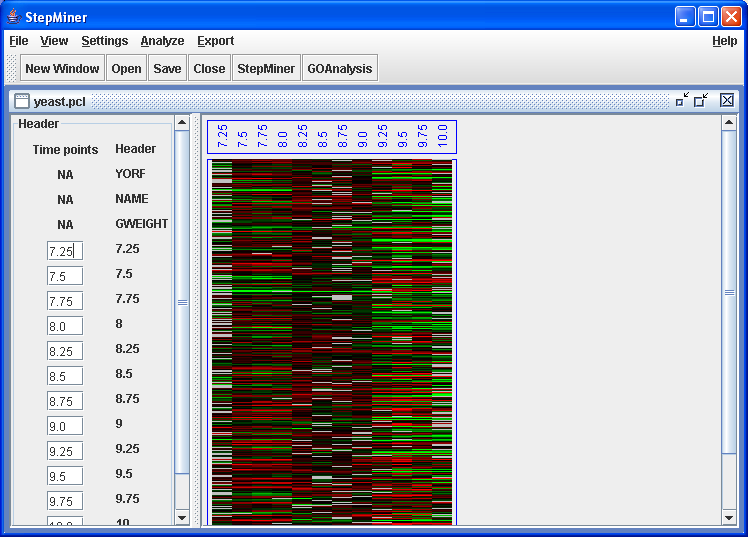
yeast.pcl opened.
Click on StepMiner button or click on → menu item to run StepMiner on the file opened.

Enter a filename to save the StepMiner results in PCL format.
The output file will be in PCL format, but the genes will be reordered by StepMiner as described below. The PCL file can be explored using Java Treeview .
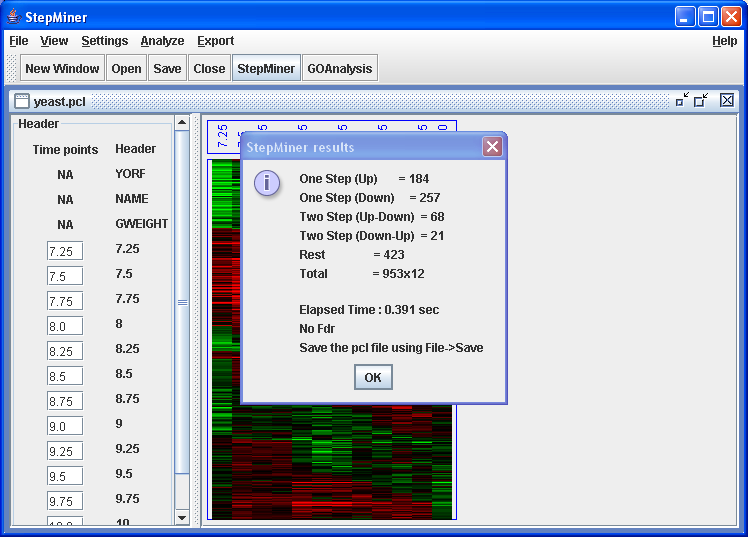
Result of the StepMiner analysis is displayed in a dialog box.
The StepMiner results report the number of one-step (Up or Down) and the number of two-step (UpDown or DownUp) matches. The number reported as "Rest" indicates the number of genes that didn't match any steps with the given p-value cutoff. The pvalue cutoff for the StepMiner can be adjusted using → . The numbers reported under "Total" are the total number of genes and arrays used for the StepMiner analysis.
Click on "ok".
yeast.pcl heatmap after StepMiner analysis.
The heatmap clearly shows the steps in the gene expression. Genes are ordered as follows: The one-step genes are first, followed by the two-step genes, followed by genes that could not be classified. The one-step and two-step genes are further subdivided by whether the first transition is increasing or decreasing (the increasing genes are first). Within those groups, genes are then sorted by the time of the first transition, with earlier transitions occuring first. Genes that have the same direction and time of transitions are ordered according to the p-values of the StepMiner.
After StepMiner analysis has been run, an analysis using the gene ontology can be performed to see if gene annotations for certain functions, processes or components are enriched during sets of genes that change in the same way.
StepMiner's algorithm is derived from that in Gavin Sherlock's GOTermFinder perl script, but has some additional pruning heuristics to preferentially report more specific annotations.
In order to run GO analysis on the StepMiner results, the name of the organism must be specified in the settings. The default value for the organism is set to "Hs" (Human). The GO analysis program looks for gene annotation file for the organism speciifed and gene ontology file in the current working directory. The GO analysis program matches the gene name from the second column of the PCL file to the gene names present in the gene annotation file and perform a hypergeometric distributation based statistic. The GO analysis program also prunes significant generic GO terms that includes many significant specific GO terms.
Following are the annotation files and links that are used for different organisms.
| Organism | Description | Gene annotation file |
| Sgd | Budding yeast | gene_association.sgd |
| Hs | Human | gene_association.goa_human |
| Mm | Mice | gene_association.mgi |
| Pombie | Fission yeast | gene_association.GeneDB_Spombe |
Click on → menu item.
Change the "Organism" option to "Sgd" in "GOAnalysis" section
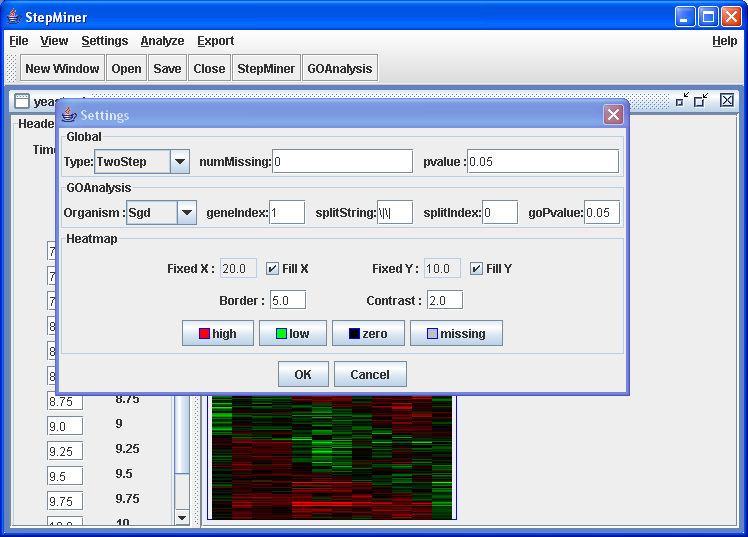
GO Analysis settings
Click on "ok".
Click on GOAnalysis button or → menu item.
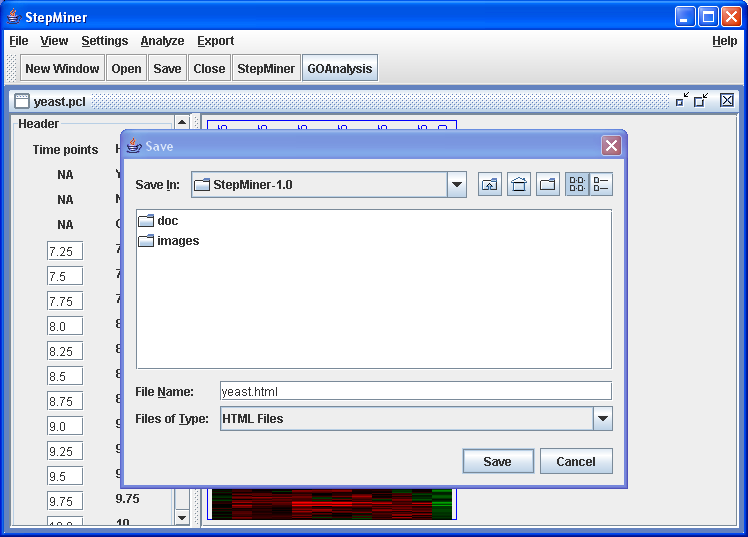
File save dialog after GOAnalysis. Enter yeast.html .
Click on "Save" button to run the GOAnalysis. It might take several minutes for the GO anlysis to finish. StepMiner window will not respond until after the GO analysis finished.
The results of GO analysis is saved in file yeast.html
After the GO analysis is finished, open yeast.html
using a web browser.

GO Analysis on the StepMiner results.
The GO Analysis is performed on the gene sets of
the StepMiner program. The results are grouped into four
different categories: one-step (up regulated and down regulated),
two-step (up-down and down-up). The user can browse the results
by clicking on the
 . Cick on "ExpandDepth 2" to see all the significant GO terms.
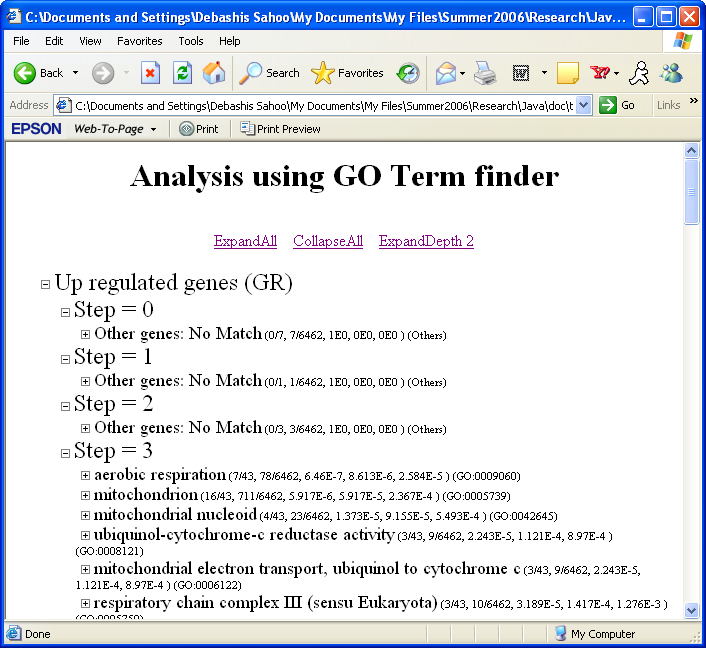
Significant GO terms.
"Other genes: No Match" contains the list if genes that have none of the GO terms significant. The results show the significant GO terms followed by a list of statistics. In this example the list of genes at "Step 3" have 43 genes, 7 of them have aerobic respiration annotation, 16 of them have mitochondrion etc. Total number of genes in the gene annotation file is 6462, 78 of them have aerobic respiration annotation and 711 of them have mitochondrion etc. The following three number represent p-values using the hypergeometric distribution, using FDR correction and using the Bonferroni correction. The GO term id follows the pvalues e.g. GO:0009060 is the GO term id for aerobic respiration.
If not, please contact us at sahoo at stanford dot edu or dill at cs dot stanford dot edu .
We would also like to here any feedback, requests, or comments you may have. We expect to improve and enhance StepMiner greatly in the future.